Environmental Effects on Zip Line Rider Speed
Every operator knows that when a zip line rider steps off the top platform onto a zip line, gravity takes over and races them down to the bottom of the line. Gravity plays the major role in generating speed, but it is only one of the many variables that affects rider speed. A good zip line designer needs to optimize slope, length and line tension to harness the right amount of gravity to balance with environmental factors to achieve a maximum speed and arrival speed which align with the products that are being utilized.
Many varied environmental effects will cause the actual arrival speed to diverge from the expected arrival speed. Some of these include drag, wind, trolley friction, rider weight and temperature. Rider speeds that are higher or lower than anticipated can quickly diminish the zip line experience for both riders and operators. When the speed is too fast, trolley speeds may exceed manufacturer limits, or the trolley may hit the brake, capture block or platform at speeds in excess of manufacturer recommendations, potentially causing system failures. If the arrival speed is too slow, the rider may end up stranded out on the line and may require a retrieval.
To highlight the influence that these environmental effects have on rider speed, a 1000 ft [304.8m] zip line with 10% slope and a 175 lb. [79.4kg] rider will be used, as a baseline design in the following examples. All values shown are examples based on principles of engineering. The values in this report should be considered estimates to be used for the reader to understand relative effects for this example only. This design is clearly not an optimal situation,
All zip line designs must be tested upon installation to verify that the speed target predictions are performing as expected. Testing may include the use of specialized GPS or radar instruments that can accurately measure speeds throughout the ride or at a certain location on the zip pathway (ex. brake location). Testing that simulates the varying environmental conditions at the site is recommended.
- Drag on the Rider:
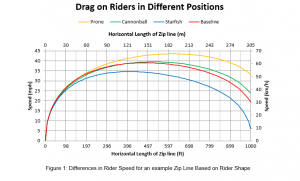
Drag is the force generated as air resistance pushes in the opposite direction of travel for of the zip line rider. The amount of drag force is related to the speed the rider is moving. The faster the rider is going the more drag force will be generated, which will reduce the maximum speed that can be reached. Also, the shape the rider holds as they descend the line influences the amount drag on the rider. Whether the rider feels they are going too fast and starfish to slow down, or feel they aren’t going fast enough and pull into a cannonball to get going faster, the rider can dramatically influence the arrival speed. Figure 1 shows the 27 mph [43.4 km/h] difference in speed that can occur by changing the shape the rider holds.

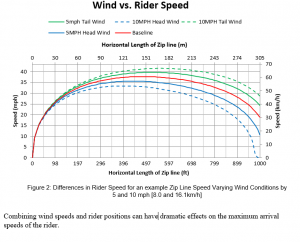
Tailwinds and headwinds will also increase and decrease rider speed because they increase or decrease rider drag. While a constant wind speed throughout an entire ride doesn’t usually occur, to simplify this example, a constant wind speed is applied. As can been seen in Figure 2, a constant 5 mph [8.0km/h] tail wind can increase the arrival speed of a rider by 6 mph [9.6 km/h] and a constant 10 mph [16.1km/h] head wind can cause the rider to not make it to the end of the zip line.
 2. Trolley Friction:
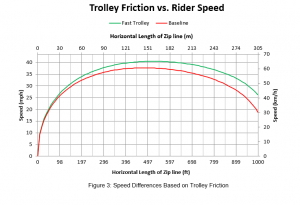
Each brand and style of trolley has different friction characteristics. Friction will always reduce a rider’s speed. Depending on the design and bearings used there may be more or less friction in the trolley. Also, a trolley that is out of the box will usually have higher friction characteristics than one that is in the middle or at the end of its life cycle. Trolleys at different operating temperatures will also have different friction characteristics. Even if you are using the same brand and style of trolley, each individual trolley friction will vary. Figure 3 shows that an increase in arrival speed of 8 mph [12.9 km/h] can potentially be achieved in this example when using a lower friction trolley.
 3. Rider size and weight:
Heavier riders will generally have higher maximum speeds. More weight will generate a higher downward force and when this force is applied to the zip line cable it is translated into higher forward force. Figure 4 demonstrates that a rider that is 100 lb. [45.4kg] heavier will increase rider arrival speed by 8 mph [12.9 km/h] and a 100 lb. [45.4kg] lighter rider will decrease rider arrival speed by 23 mph [37.0 km/h]
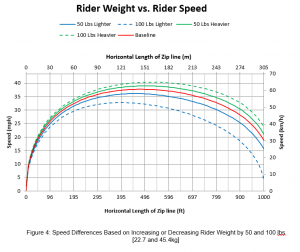
The size of the rider also plays into the amount of drag force generated since a heavier rider is generally larger in size which means that more drag force is generated at higher speeds. Figure 4 includes the effects of rider size.
4. Temperature and Cable Tension:
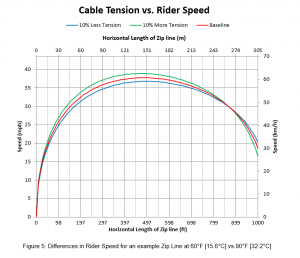
Zip line cables, just like all materials, expand or shrink based on their temperature. As the air temperature changes throughout the day the cable will get longer as it heats up and get shorter as it cools off. For example, on a summer morning the air temperature may start off at 60° F [15.6° C] and by midday it will be up to 90° F [32.2° C]. For a 1000 ft [304.8m] cable this 30° F [-1.1° C] change in temperature means 2.5 inches [6.4cm] of increased cable length (which translates to much higher vertical deflections when loaded). Although the effects are minimal on a 1000’ line, longer cables may be affected greatly by moderate changes in temperature. This change in cable length and tension alters how gravity generates rider speed. To show how much cable tension influences rider speed, Figure 5, shows our 175 lb. [79.4kg] example rider on a cable with 10% greater initial tension generates a higher arrival speed and lower maximum speed, while the same rider on a cable with 10% less initial tension has a lower arrival speed and higher overall speed. Cable temperatures may not match the ambient air temperature.
Conclusion:
During a day on the zip line course, the environmental conditions and rider weights will vary, and the combined effects will create a range of rider arrival speeds. Note in Figure 6 that if temperature (60-degree range), wind (up to 5 mph head or tail wind), rider weight and size are all stacked up in their combined conditions, maximum and minimum rider arrival speeds can vary by more than 26 mph [41.8 km/h].
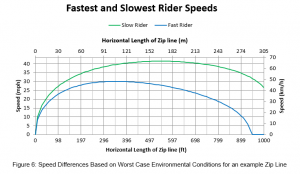
Because of the wide range of possible speeds, it is imperative to take into consideration all environmental conditions during the design and testing process of zip line systems. A maximum and minimum speed envelope chart (as shown in Figure 6) is a valuable tool to help visualize the potential variability that may occur based on the range of environmental conditions.
Since environmental conditions vary greatly site to site, understanding site specific maximum and minimum speed envelops will help to improve ride quality and define brake design requirements. Testing that simulates the varying environmental conditions is also recommended.
Prior to building, testing, or troubleshooting a zip line, it is recommended that you consult a qualified professional, with experience and a high level of confidence in estimating zip line speeds, to minimize the amount of re-design and re-testing required. We have found that it is much simpler to design a zip line with a reasonable speed envelope chart from the very beginning. It is more complicated and costly to redesign an already installed structure that is not performing optimally.
DOWNLOAD THIS ARTICLE HERE: Article – Environmental Effects on Zip Line Rider Speed
